
Why We Don’t Really Know What America Believes
Unsplash photo
(ANALYSIS) Let’s get nerdy. For those of you who sit around and wonder about the intricacies of polling about religion, this is the post for you.
Let me start by stating a fact that seems incomprehensible to even type out, but it undergirds almost every single graph that I produce: We don’t actually know the religious composition of the United States with any real precision.
I know that sounds bizarre. But the honest truth is that we are relying on a whole bunch of “best guesses” based on sound methodology and replication — and we have no way to know for certain if any of them are right.
The reason is simple: The United States made it illegal to ask about religious affiliation on the Census back in the 1970s. (This short piece from Pew explains the whole mess well).
READ: Pastors And Churchgoers Say Their Congregation Is Multigenerational
That puts researchers like me in a real bind, because without a Census benchmark there’s no authoritative reference point to weight our surveys against. We know exactly what share of Americans have a four-year college degree because the Census tells us. We have no equivalent anchor for Catholics, or evangelicals, or the religiously unaffiliated.
To their great credit — and great expense — Pew has tried to fill this void with the National Public Opinion Reference Survey (NPORS), and it’s a genuine methodological achievement. But everyone working in this space knows that what we really need is a Census benchmark, and we don’t have one.
In a post from February, I pulled back the curtain on survey methodology — specifically the difference between probability-based polls and opt-in panels. I’m not going to rehash all of that here, so I’d strongly encourage you to go read it first. But in short: Probability-based surveys like the Pew Religious Landscape Study randomly select respondents from the full population, while opt-in panels like the Cooperative Election Study draw from volunteers — and that distinction can produce meaningfully different pictures of American religion.
How meaningfully different? That’s exactly what today’s post is about. Let’s start by comparing the two surveys on the basics: religious attendance and religious affiliation across the full sample.
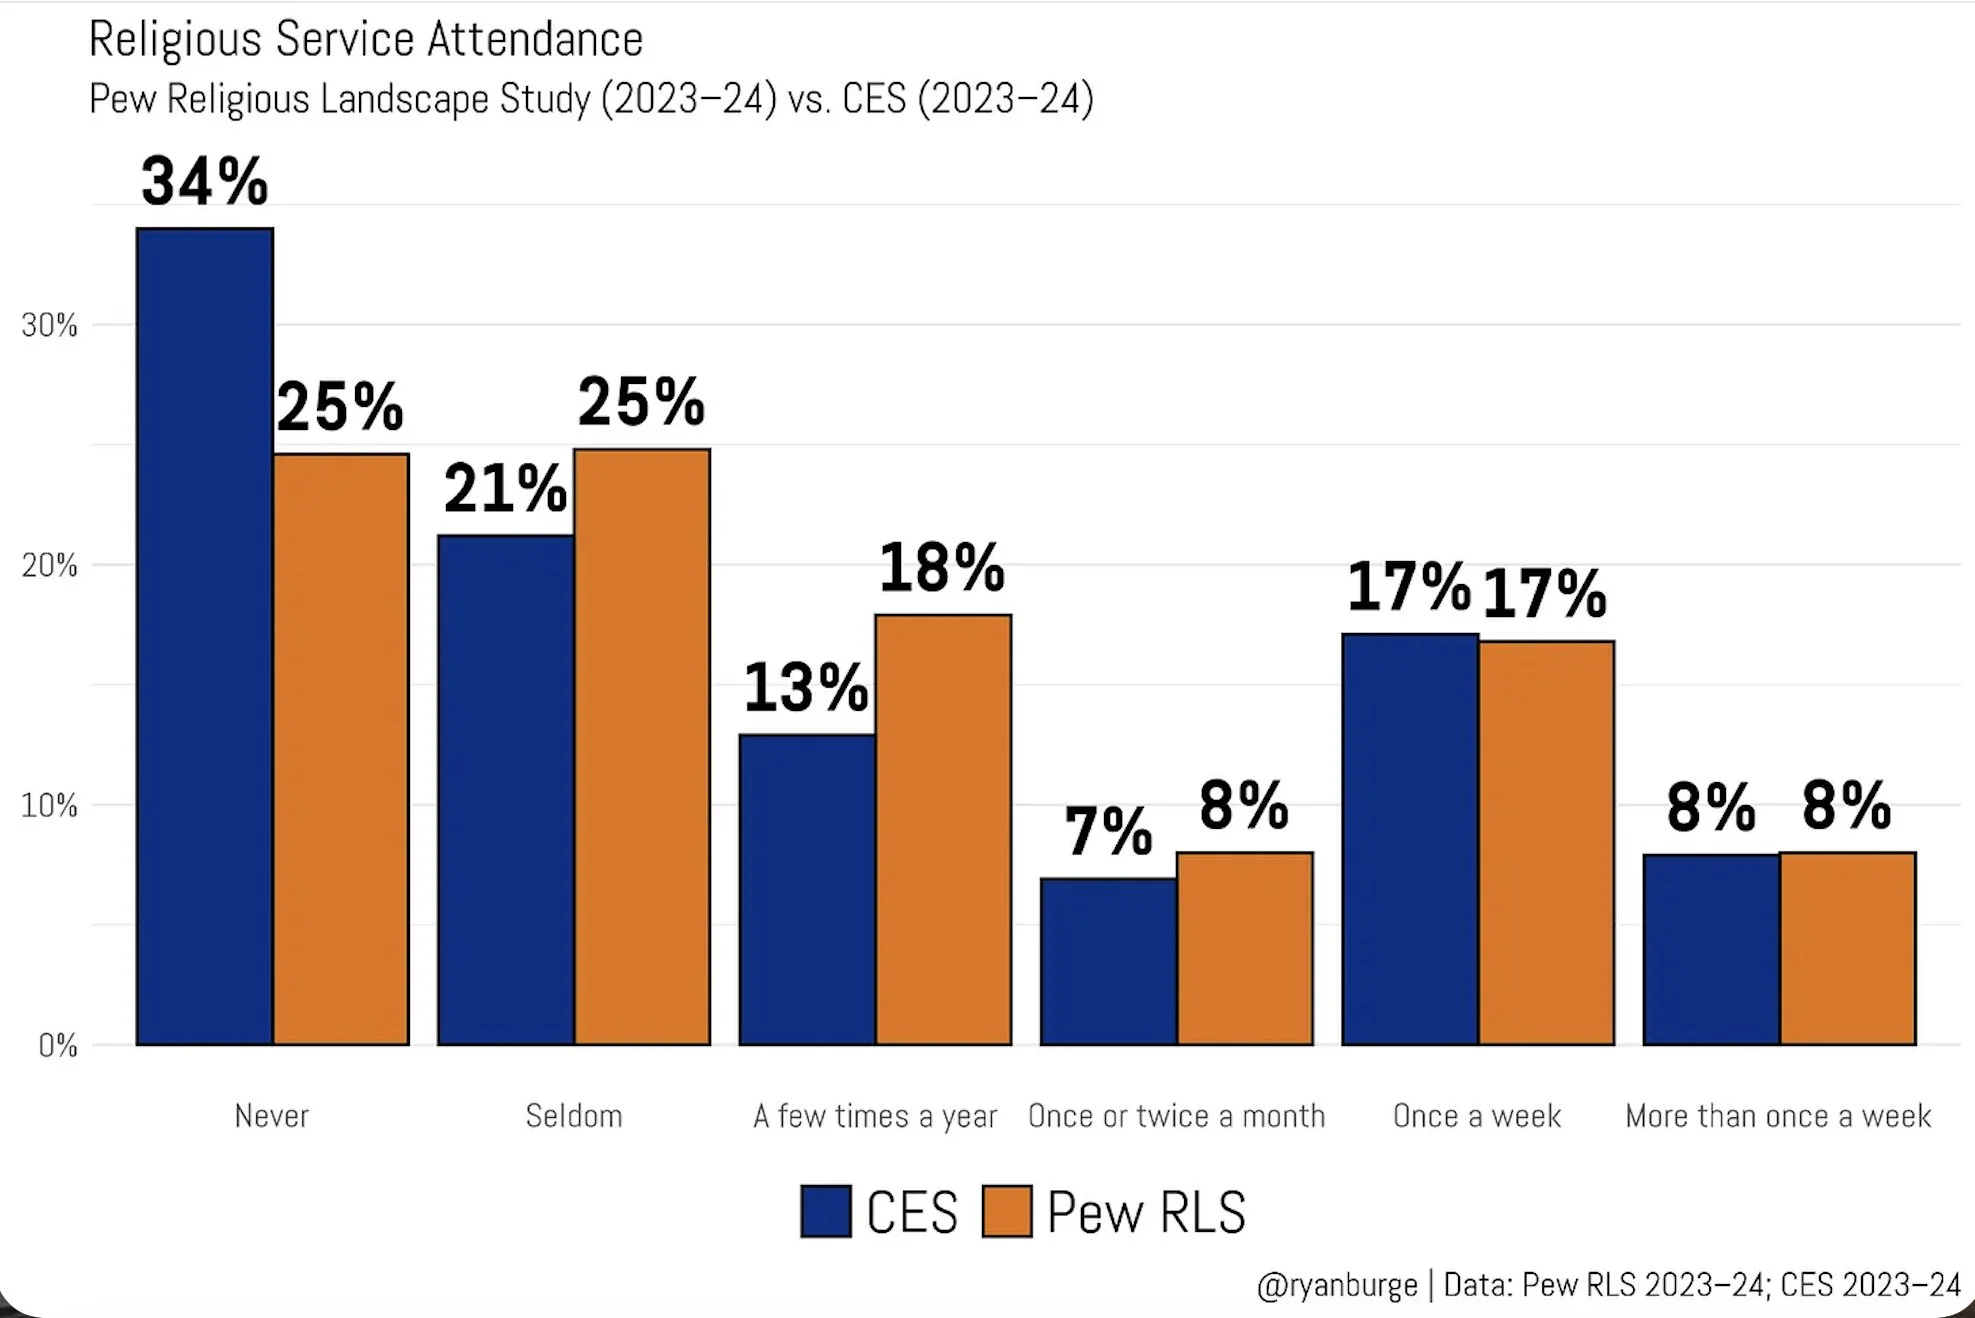
It doesn’t take long to find a meaningful difference between the two instruments. In the CES, 34% of respondents say they never attend religious services, compared to just 25% in the Pew data — a nine-point gap that would be genuinely alarming if it held up across the board. But zoom out a little and the picture gets more complicated. Pew actually records a higher share of “seldom” attenders than the CES — 25% versus 21%.
Add those two bottom categories together and the gap shrinks considerably: 55% of CES respondents attend less than once a year compared to 50% in Pew. That’s a five-point difference, which is not nothing, but it’s hardly a chasm.
What I find most reassuring is the right side of the graph. The share of CES respondents who attend weekly or more?
Exactly 25% — the same figure Pew produces. On the measure that matters most for congregational health and religious vitality, the two surveys are in complete agreement.
You can read the rest of this post on Substack.
Ryan Burge is an assistant professor of political science at Eastern Illinois University, a pastor in the American Baptist Church and the co-founder and frequent contributor to Religion in Public, a forum for scholars of religion and politics to make their work accessible to a more general audience. His research focuses on the intersection of religiosity and political behavior, especially in the U.S. Follow him on X at @ryanburge.