
2024 Election Post-Mortem: Atheists And Agnostics
(ANALYSIS) My first book was entitled “The Nones: Where They Came From, Who They Are, and Where They Are Going.” It was published — what feels like a lifetime ago — in 2021. I’m pretty proud of that little volume because it established my approach to thinking about non-religion in the United States.
One of the points I make, which I hope will live on in scholarly discourse, is that the nones are not a homogenous mass of people. There are clear subgroups within this label that need to be understood with much more granularity.
The three categories I used in that book were based on how the Pew Research Center asks about religious belonging. The survey gives people twelve options — the first eight are groups like Protestants, Catholics, LDS, Muslims, etc. Option 9 is atheist, option 10 is agnostic, and option 11 is “nothing in particular.” I have an entire chapter entitled “Not All Nones Are Created Equal,” where I go into detail about how those three groups differ.
One major bifurcation is between atheists/agnostics and the “nothing in particular” group. In their recent book, “Secular Surge,” Campbell, Layman and Green call the first two groups “secular” people, while those in the “nothing in particular” category are simply non-religious.
Today, I want to describe how these secular people have voted in the last five election cycles. But before I get there, let’s visualize the rise of atheists and agnostics since 2008.
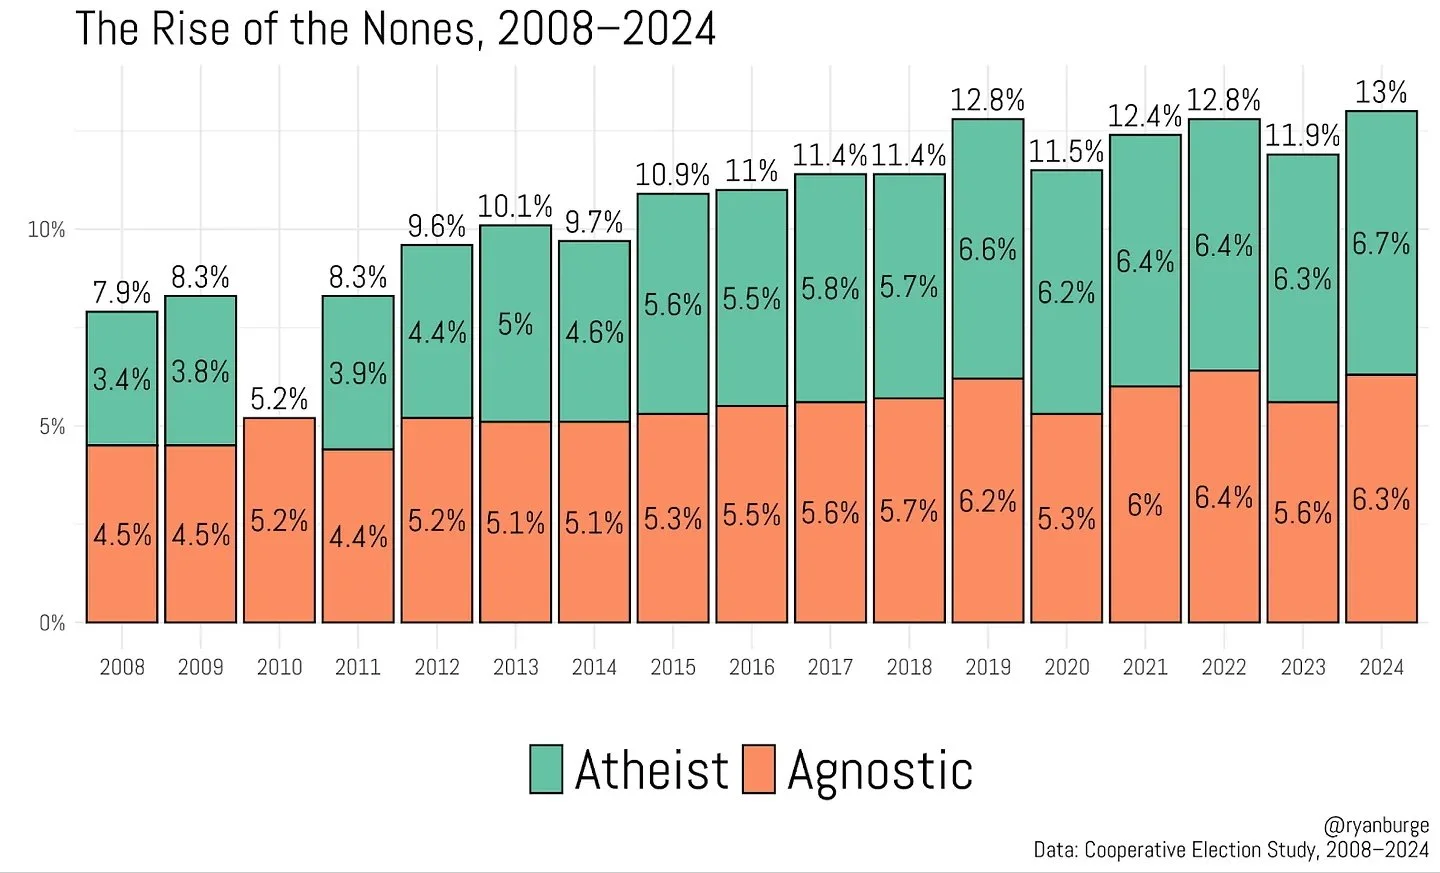
In 2008, just about 8% of the sample identified as atheist or agnostic. I know you’re wondering about what happened in 2010 — the CES just left off the atheist option. I don’t really know why, but I did write an entire paper about it. Over time, however, the share of secular people slowly rose. It was clearly above 10% by 2015.
That said, the last couple of years have seen relative stability in the share of the country identifying as atheist or agnostic. It was 12.8% in 2019, but fell below 12% in both 2020 and 2023.
The most recent estimate is right at 13% — the highest we’ve seen so far, but not statistically different from the estimates in 2019 and 2022. I think it’s fair to say that these two groups have experienced stagnant growth over the last five or six years.
So then the question is: How do they vote on Election Day?
You can read the rest of Ryan Burge’s post at his Substack page.
Ryan Burge is an assistant professor of political science at Eastern Illinois University, a pastor in the American Baptist Church and the co-founder and frequent contributor to Religion in Public, a forum for scholars of religion and politics to make their work accessible to a more general audience. His research focuses on the intersection of religiosity and political behavior, especially in the U.S. Follow him on X at @ryanburge.