
The Religious Composition Of Political Parties Over The Last 50 Years

(ANALYSIS) American religion is shifting rapidly now. The nones are climbing every single year. Mainline Protestants are losing ground day by day. And evangelicals are still having a huge impact on American culture, religion and politics.
The purpose of this post is to give a broad overview of just how much the parties have shifted from the 1970s through today.
The coalition that elected the first Catholic president (John F. Kennedy) and the second one (Joe Biden) aren’t the same at all. In fact, the Biden coalition would have been hard to fathom for a Democratic strategist in the early 1970s. And I wonder to what extent the leadership of both parties are really thinking about religious groups when they consider how to win over voters in elections every two or four years.
A couple of years ago, I wrote a post for Religion News Service that I still think about a lot. It was called, “By their tweets you will know them: The Democrats’ continuing God gap.” I scraped the tweets of every Democrat left in the primary process and analyzed them for any religious language. Outside Marianne Williamson, almost no one mentioned God on their Twitter account.
From a total of 58,000 tweets I collected, this is the count of religious terms:
Islam: 69 mentions
Muslim: 61 mentions
Christian: 59 mentions
Jesus: 15 mentions
Bible: 11 mentions
Koran: 2 mentions
Yeah, Democrats just don’t talk about Christianity that much despite the fact that most of their constituents are Christians. But how many and how is that changing? Let’s get to it.

In the 1970s, about 1 in 5 Democrats was an evangelical, and the same share were mainline Protestants. Black Protestants were another 13%. So, 56% Protestant. The plurality group was clearly Catholics at 31%. The nones were just 6% of the Democratic coalition. They were only 5% of the entire population, after all. So this makes sense.
By the 2010s, there had been some pretty big (and pretty small) shifts. Evangelicals only dropped four percentage points from the 1970s — I bet most people don’t realize that. Even today, evangelicals are 17% of the Democratic Party. The mainline are down by over half, though. That’s because of two factors: There just aren’t that many mainliners anymore, and the ones who are left actually lean to the right just a bit. The Catholic share is also down five percentage points.
The nones are rising, though. From data collected between 2010 and 2018, the share of Democrats who were nonreligious was 26%. It’s actually a lot higher than that when you just look at the last election cycle. I will do that in just a minute. Meanwhile, Black Protestants are the same share, and the “other faith” category is up just two points.

How about the religious composition of the Republicans? A much different picture emerges here. In the 1970s, nearly half of all Republicans were mainline Protestant Christians. That’s nearly twice the share of evangelicals at just 24%. The only other religious group to register significant numbers was Catholics at 19%. Those three groups combined (evangelical, mainline and Catholic), get you 90% of the entire GOP in the 1970s.
The incarnation of the Republican Party in the 2010s is completely different. The mainline absolutely collapsed from 46% in the 1970s to just 17% by the 2010s — a decline of 29 percentage points. Meanwhile, the share who were evangelical rose 14 percentage points to 38% in the 2010s. The importance of evangelicals to the Republican Party cannot be overstated.
However, there are other signs of movement as well. The Catholic share rose six percentage points, to 25%, and the nones went from 3% in the 1970s to 12% in the 2010s. While nonreligious folks tend to lean toward the Democrats on election day, that doesn’t mean that they aren’t having a measurable impact on the Republican Party, as well. You don’t get to 30% of the population by just being linked to one political party.

Here’s another look at this using religious attendance as our metric. In the 1970s, about 13% of Democrats never attended religious services, and 36% were attending weekly or more. In total, about half of all Democrats reported attending religious services once a month or more in the 1970s. The Democrats were certainly not a party of the godless five decades ago.
Over time, the shifts are fascinating because they are basically all happening at the ends of the religious attendance spectrum. Never attending Democrats doubled from 13% to 28%. Meanwhile, the share who attended nearly every week or more went from 36% in the 1970s to just 25% in the 2010s. Now, just 41% of Democrats are monthly attenders — down about 11 points from the 1970s.
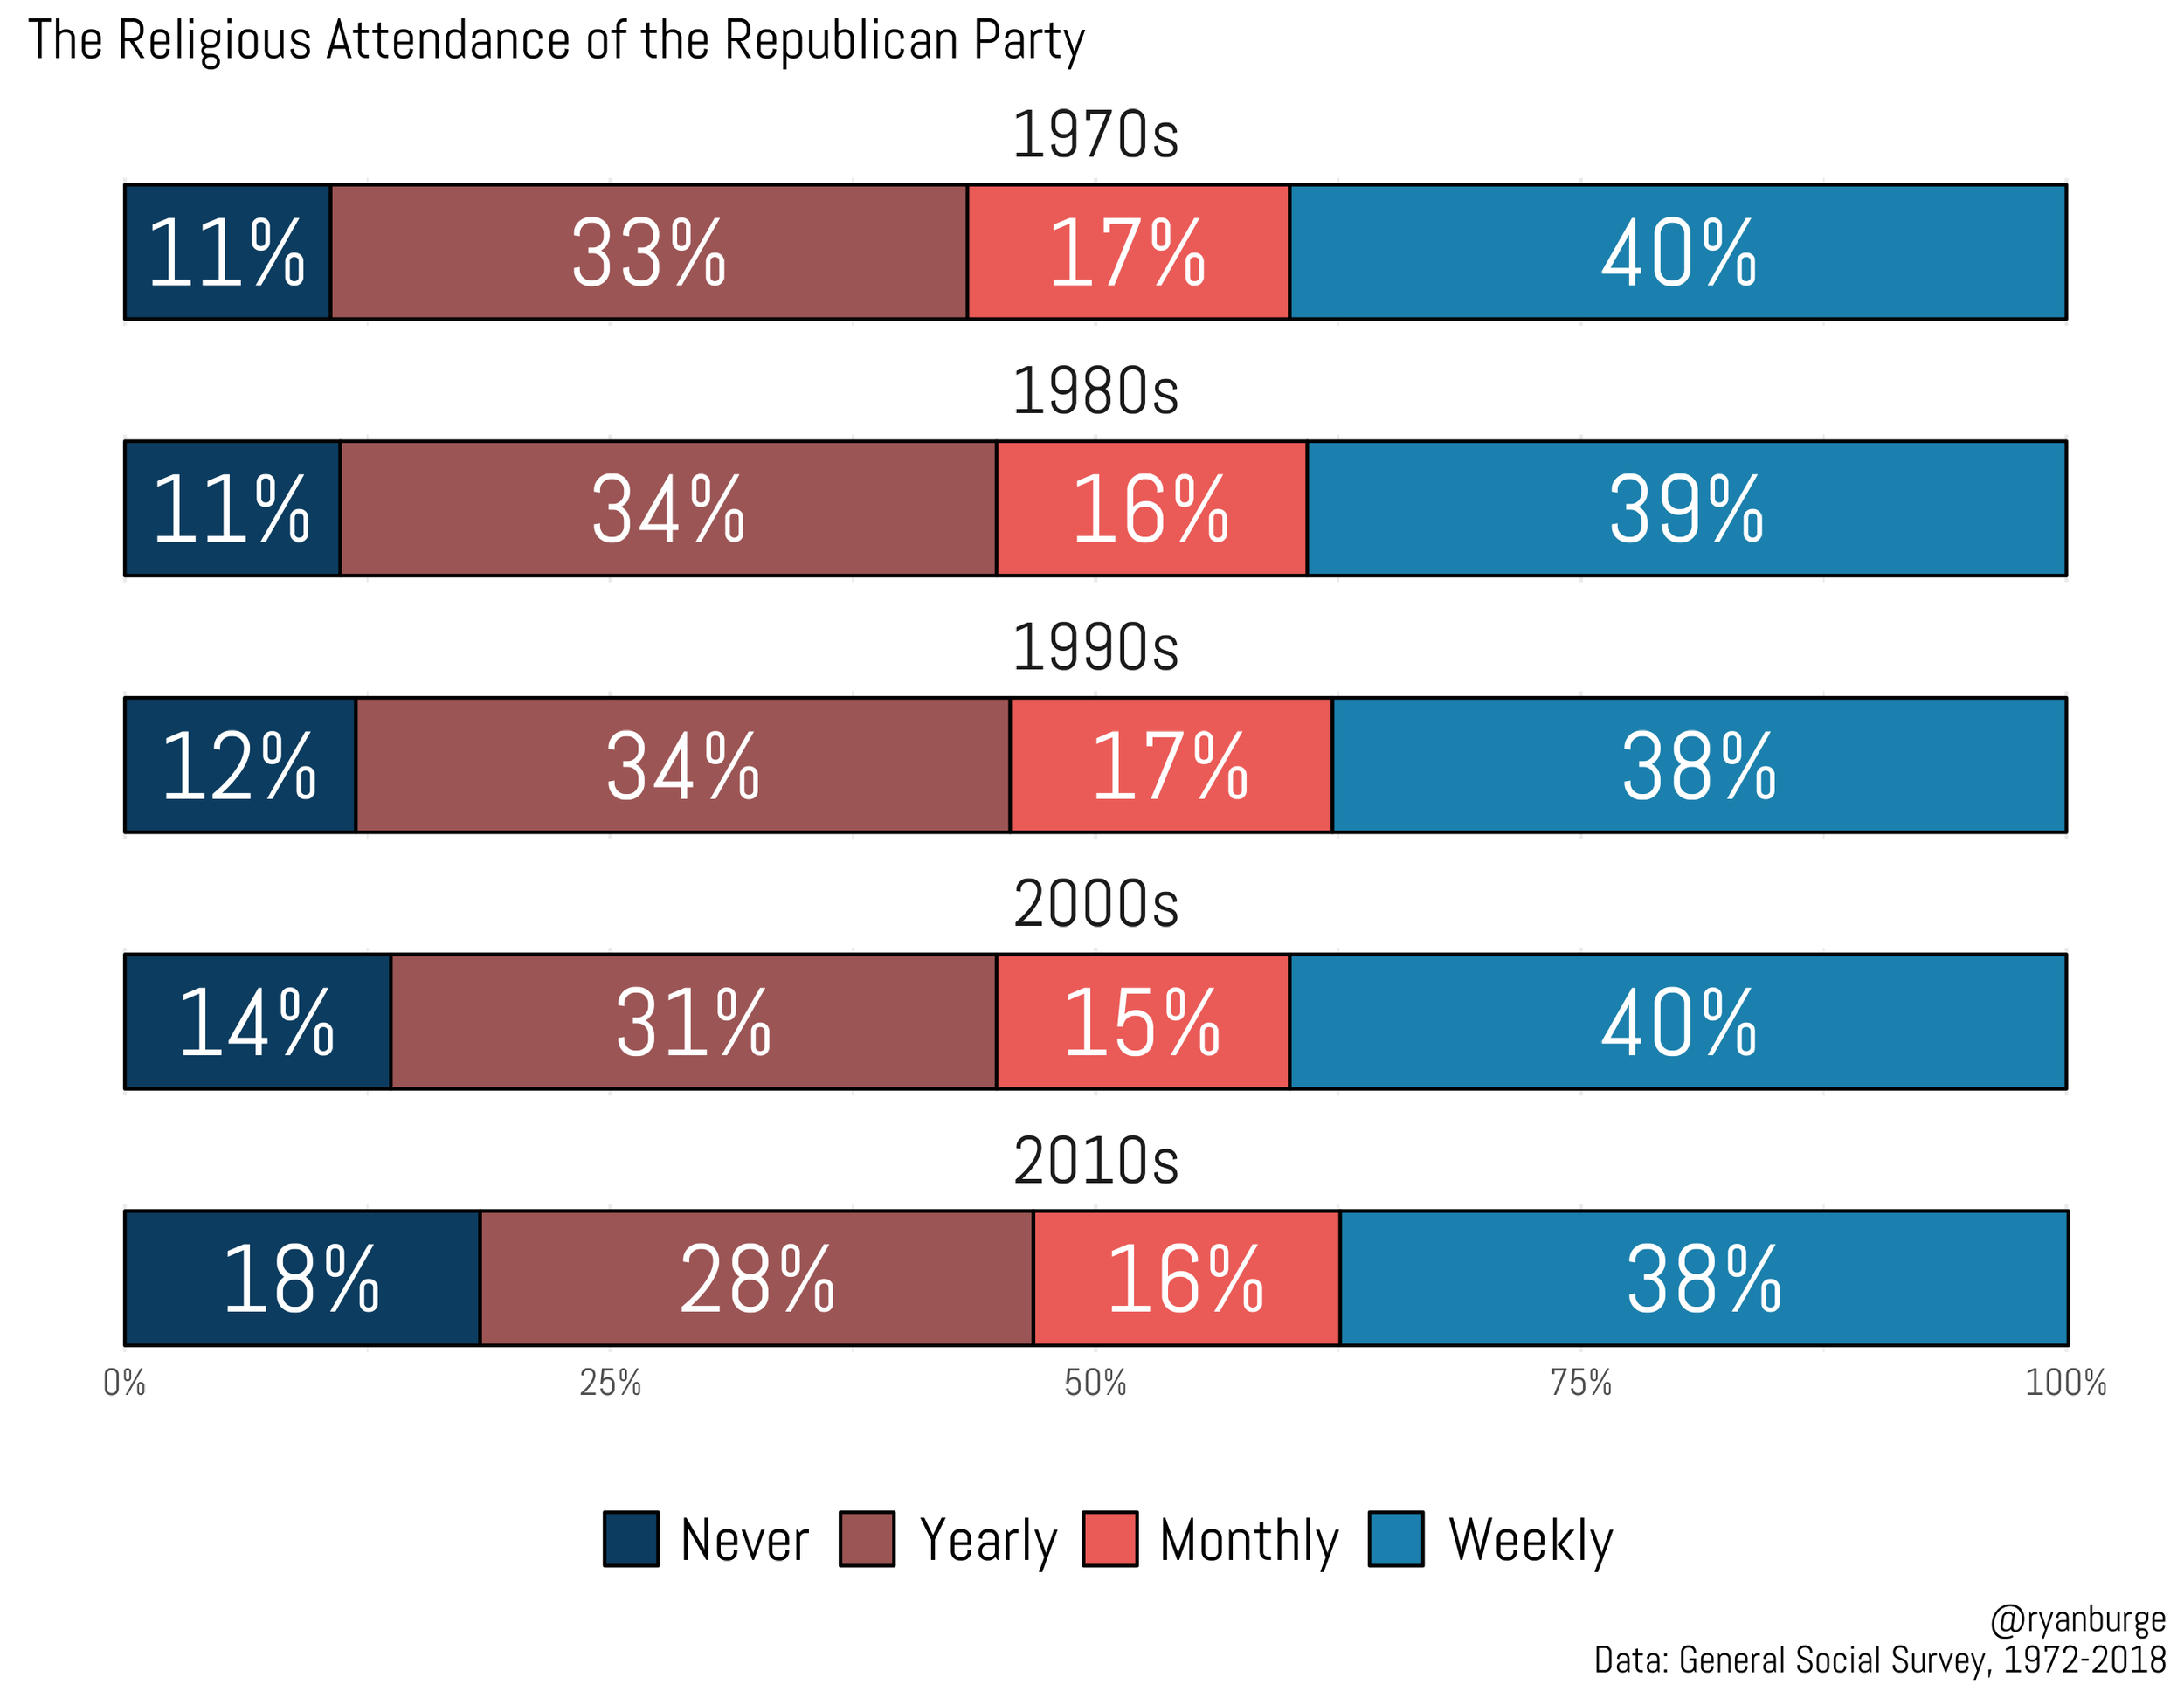
The Republican Party is downright boring, in comparison. In fact, there’s almost no difference in the data analyzed from the 1970s compared to the 2000s. Never attenders rose slightly, but the other three categories stayed essentially the same. The biggest shift happened between the 2000s and the 2010s. The share of never attenders jumped by four percentage points. But that was almost all at the expense of the yearly attenders (down three points).
Listen, I like the General Social Survey a lot. It’s the only tool I have to track religion over the last five decades. But it’s big drawback is that the sample size is really small. The Cooperative Election Study began in 2008 and has a much larger sample size. Additionally, it’s always been online, which I think reduces social desirability bias and gets us closer to the real answers when it comes to religion. So, let’s look at the Democrats attendance patterns in the last several election cycles using the CES data.
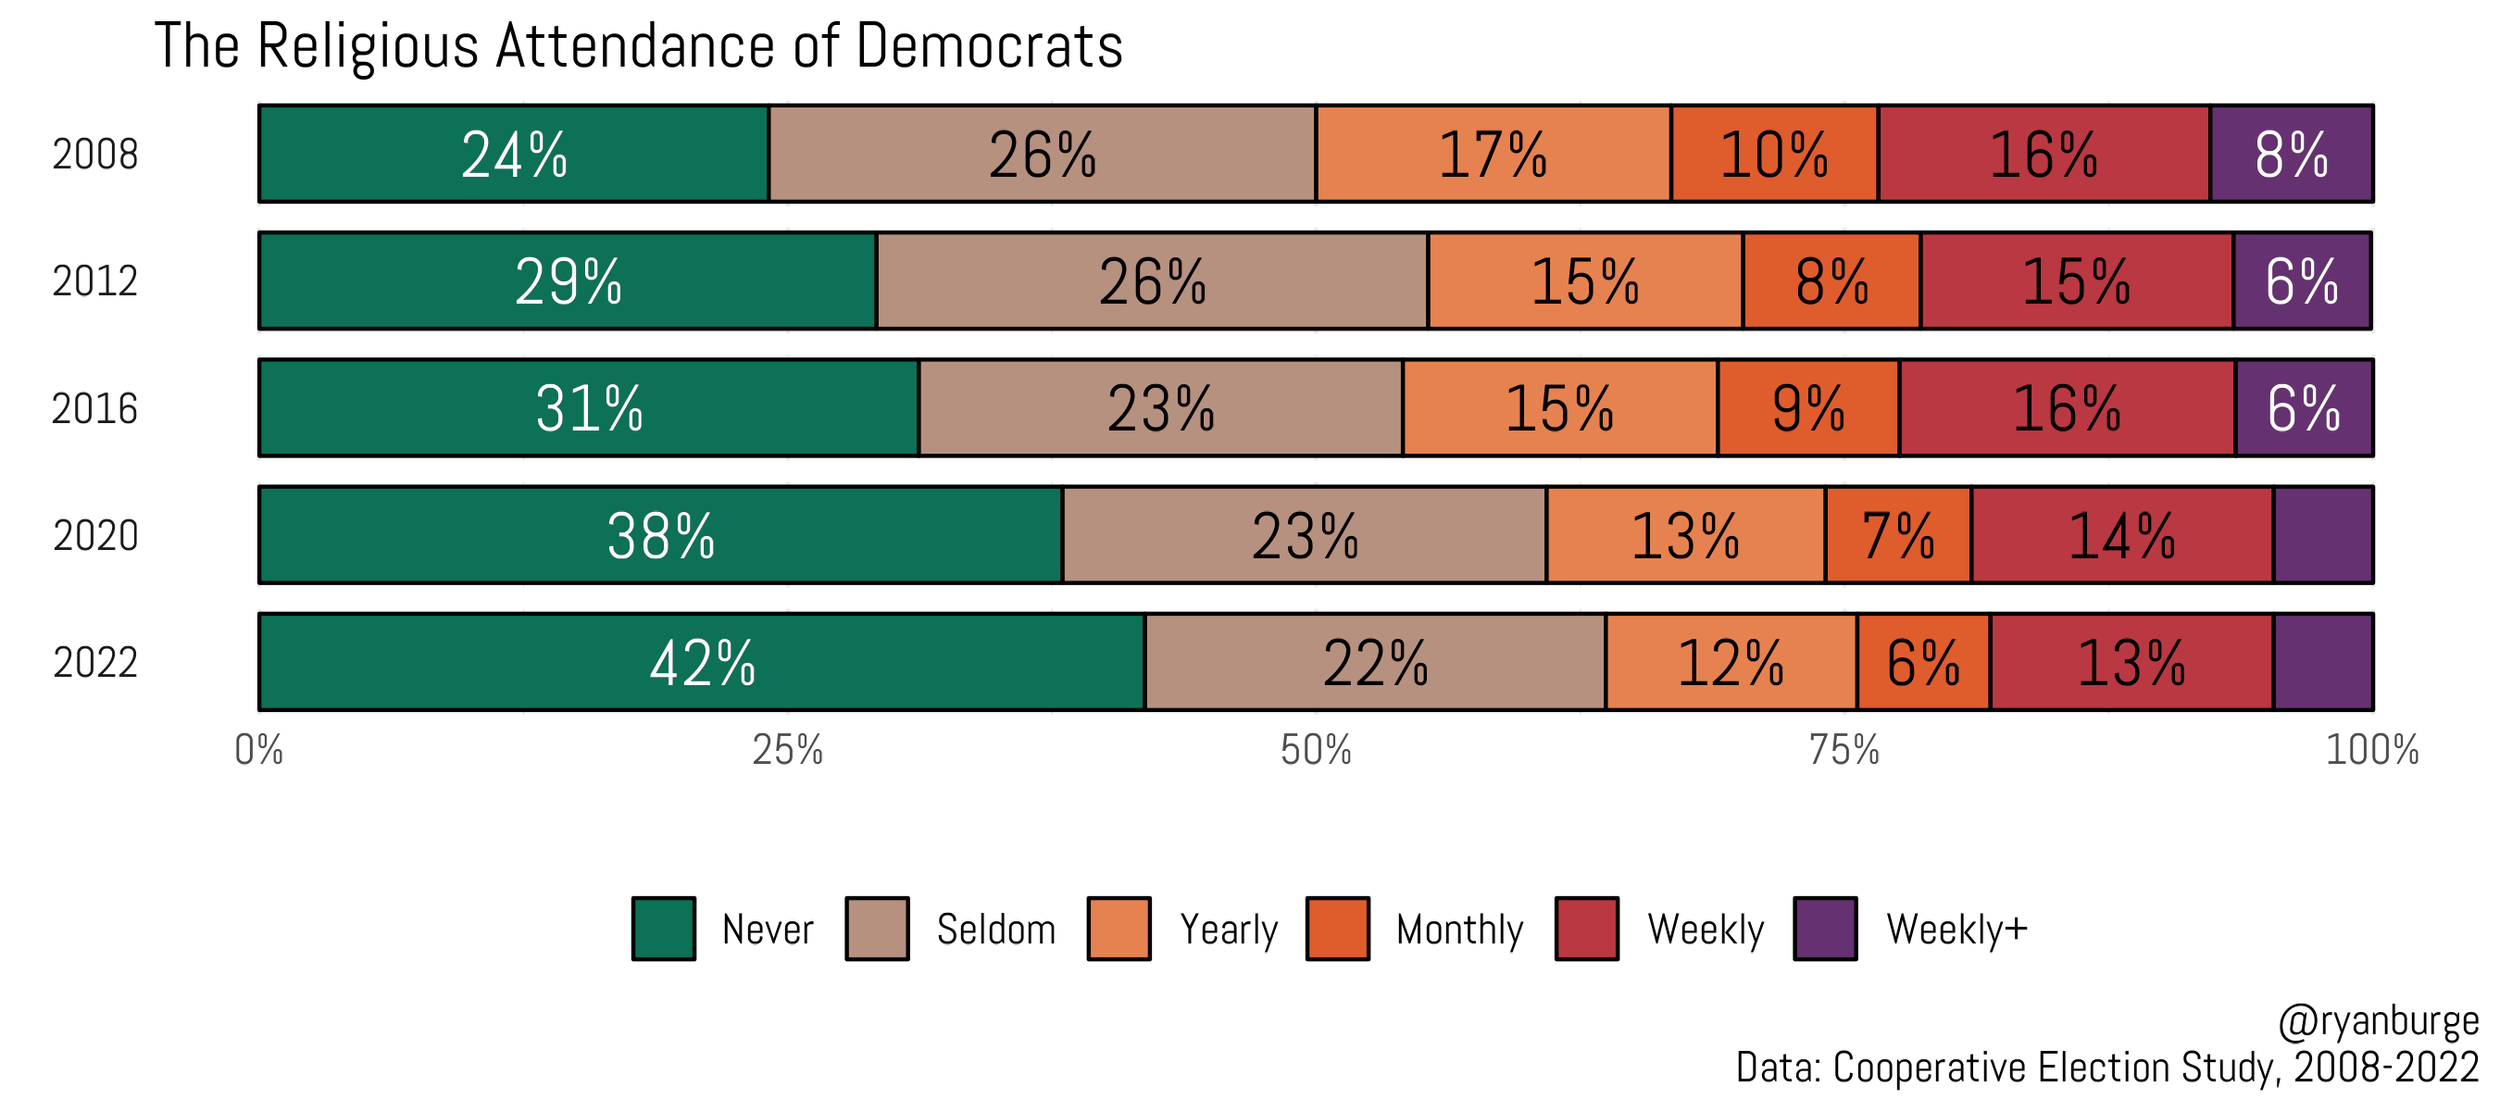
In 2008, about half of Democrats were in the never or seldom category. In comparison, nearly a quarter said that they attended religious services every week or more. So, the never/seldoms outnumbered the weekly attenders 2-1. About a third of Democrats were at a house of worship at least once a month.
By 2022, those numbers had shifted significantly. Now, nearly two-thirds of all Democrats added religious services less than once a year (64%). In comparison, just 18% were attending once a week or more. For every weekly attending Democrat, there were 3.5 who went once a year or less. Yeah, that’s a big change from the Obama coalition of 2008. Now, about a quarter of Democrats attend religious services once a month or more, down from 33% in 2008. If you are looking for evidence of the pew gap — here it is.

The overall religious attendance of Republicans is consistently higher. In 2008, about 30% of Republicans were seldom/never attenders compared to 50% of Democrats. Forty-four percent of Republicans were attending weekly in 2008 compared to 24% of Democrats. In total, 55% of Republicans were in the pews once a month or more in 2008.
In 2022, the religious attendance of the GOP had fallen dramatically. Now, 44% of Republicans are in the never or seldom buckets — compared to 64% of Democrats. At the same time, weekly attendance dropped to 35%, about double the rate of Democrats in 2022. But notice when the biggest drop in weekly attenders occurred — between 2008 and 2016. Since Trump’s election, weekly attenders have basically stuck around 35%.
But what about the religious composition of both parties when Obama won in 2008 compared to the Biden victory in 2020?

The share of Democrats who are evangelicals is basically the same in both years — 13%. But the mainline has dropped from 16% to 12%. Again, that’s probably because of numerical decline as much as it as about voting shifting. The big drop in White Catholics is notable, though. From 16% during the 2008 contest to just 10% today. That’s not about numeric decline because the White Catholic share just hasn’t dropped that much in the general population. This one is about vote switching.
The other big story is clearly the nones. That’s the future of the Democratic Party. Obama’s winning coalition was 7% atheists, 9% agnostics and 19% nothing in particulars. Thus, 35% of all Obama’s voters came from nonreligious Americans. In 2020, 13% of Biden’s voters were atheists, 10% were agnostics and 22% were nothing in particulars. That’s 45% of the Democratic coalition being nones now. I don’t think it’s a stretch to think that half of the Democrats who vote in 2028 (or even 2024) will be nones.

What about the Republicans? The share of Republicans who are White evangelicals has risen over the last four presidential elections from 34% to 38%. I will say it again — there’s no more important religious voting bloc in the United States today than White evangelical Republicans. The mainline have dropped by three points — again, denominational collapse hurts both parties among the mainline. It’s also notable that the White Catholic vote share is down among Republicans, too — six points. By the way, the White Catholic vote is only 10% of the Democratic coalition; it’s 17% of the modern GOP.
Now, let’s talk about the nones. When John McCain was the nominee, about 11% of all his voters were atheist, agnostic or nothing in particular. Said another way, about 3% were atheist or agnostic. Among Trump voters in 2020, 4% were atheist or agnostic. If any Republican thinks that they can make inroads with these folks, just disabuse yourself of that notion right now. However, nothing in particulars rose to 12%. In total, 16% of the 2020 Republican coalition were nones, up from 11% in 2008.
Forty-five percent of Biden voters were nones. It was 16% of Trump voters. Meanwhile, 38% of those who pulled the lever for Trump were White evangelicals; it was only 7% of those who supported Joe Biden. The parties could not be going in more opposite directions.
One of the canonical texts I read in graduate school was called “The Great Divide: Religious and Cultural Conflict in American Party Politics” by Geoffrey Layman. He makes an argument about the growing rift in the overall religiosity of the two parties. His book was published in March of 2001. Before 9/11. Before the election of Barack Obama (twice). Before the ascendancy of Donald Trump and the intense scholarly debate about Christian nationalism.
The parties are going in opposite directions when it comes to religion. The Democratic coalition is basically this:
45% nones (evenly divided between atheist/agnostic and nothing in particular).
30% White Christians (many of whom are mainline and will likely not be around for elections in a decade or two).
20% non-White Christians.
5% all other religious groups (Muslims, Jews, Hindus, Buddhists, etc.).
The Republican coalition is this:
70% White Christians (the majority of which are White evangelicals).
15% nones (almost all are nothing in particular).
10% non-white Christians (evenly divided between Catholics and evangelicals).
5% all other religious groups (Muslims, Jews, Hindus, Buddhists, etc.).
What Layman saw in the data in the late 1990s was just the very smallest cracks in the American electorate. Now, those gaps have grown into chasms that are seemingly impossible to traverse. I don’t know how this ends, but I can think of only two outcomes that make any sense.
One is that the Republicans find a way to reach out to nonreligious voters, bringing them into their coalition in some way to offset the losses of White Christians who are seeing demographic declines.
The other is that both parties dig in and manage to carry forward with this growing God gap. The Republicans will forge a coalition of people who are both actively religious and culturally conservative (across racial lines), while the Democrats will continue to gain ground as the nones rise.
Hopefully I look back on this prediction near the end of my career and laugh at how wrong I was.
This piece is republished from the “Graphs About Religion” Substack.
Ryan Burge is an assistant professor of political science at Eastern Illinois University, a pastor in the American Baptist Church and the co-founder and frequent contributor to Religion in Public, a forum for scholars of religion and politics to make their work accessible to a more general audience. His research focuses on the intersection of religiosity and political behavior, especially in the U.S. Follow him on Twitter at @ryanburge.